Pension Plans
METRO has three pension plans which consist of two defined benefit pension plans and one defined contribution pension plan. Contributions for all three plans are authorized annually by the METRO Board of Directors during the annual budgeting process.
The Government Finance Officers Association (GFOA) has regularly awarded METRO a certificate of achievement for excellence in financial reporting for our two defined benefit pension plans. And we’ve earned the highest grade available from the Texas Comptroller's Office.

Definitions
The Non-Union Pension Plan is a noncontributory, single-employer, defined-benefit plan and was closed to new participants on October 1, 2007.
METRO makes monthly contributions to this plan which are authorized annually by METRO’s Board of Directors during the annual budgeting process.
Funding policy for the defined benefit pension plans is to contribute each year the independently calculated, actuarially determined contribution in equal payments over a 12-month period using the key assumptions provided in the actuarial methodology tab below.
The Transport Workers Union Pension Plan (Union Plan) is a contributory (effective October 1, 2018), single-employer, defined-benefit pension plan and was closed to new participants on October 1, 2012. Employees in the Union Plan contribute $3 each week through payroll deductions. Employees not eligible for the defined benefit pension plans are placed into the defined contribution plan.
METRO makes monthly contributions to this plan which are authorized annually by METRO’s Board of Directors during the annual budgeting process.
Funding policy for the defined benefit pension plans is to contribute each year the independently calculated, actuarially determined contribution in equal payments over a 12-month period using the key assumptions provided in the actuarial methodology tab below.
METRO’s monthly contributions to the defined contribution plan equals 4% of the employees’ annual salary with METRO matching up to an additional 4% of the employee’s 457(b) Deferred Compensation Plan contributions.
METRO makes weekly contributions to the defined contribution plan, which are authorized annually by METRO’s Board of Directors during the annual budgeting process.
METRO’s contributions are placed into a third-party trust account with employees’ vesting rates equally 40 percent after the second year with an additional 20 percent vesting occurring each of the next three years.
Funding policy for the defined benefit pension plans is to contribute each year the independently calculated, actuarially determined contribution in equal payments over a 12-month period using the following key assumptions:
- Actuarial cost method – Entry age normal
- Amortization method – Level percentage of payroll, closed
- Asset valuation method – five-year smoothed market value
- Inflation – 2.30%
- Salary increases:
– Union
3.25% for 2024, 4.00% for 2025, 3.50% for 2026, 4.00% for 2027 and 3.25% thereafter, with an additional 0.25% for 2025, 1.25% for 2026, and 1.5% for 2027 for bus operators hired after June 1, 1999.
– Non-Union
3.25% for 2024 and thereafter. - Actuarial assumed rate of return 6.25% is a net of an explicit assumption for expected administrative expense.
- Mortality – The mortality assumption is updated annually and is currently using the Pub-2010 General Employee / Healthy Retiree Mortality Tables for M/F projected forward (fully generational) with MP-2021 with separate tables for contingent survivors and disabled participants. This reflects the most current mortality experience published by the Society of Actuaries for public plans. This assumption includes a margin for future improvements in longevity.
Public Pension Summary
The following table shows financial information for the public pension summary and defined benefit plans as of Dec. 31, 2024.
| Information | Union | Non-Union |
|---|---|---|
| Funded ratio | 69.8% | 59.9% |
| Remaining Amortization period | 18 year | 18 year |
| Rate of return* | ||
| 1 Year | 7.5% | 8.3% |
| 3 Year | 0.2% | 0.6% |
| 5 Year | 4.7% | 4.9% |
| 10 Year | 5.3% | 5.2% |
| Assumed rate of return | 6.25% | 6.25% |
| Actuarially Determined Contribution (ADC) amount | $14,362,215 | $15,134,183 |
| Actual Employer Contribution amount | $14,447,534 | $15,152,716 |
| Unfunded Actuarial Accrued Liability (UAAL) | $139,214,731 | $138,294,863 |
| UAAL as a percent of covered payroll | 228.9% | 420.4% |
* The investment returns are calculated using the geometric method and are presented net of fees.
Union Plan
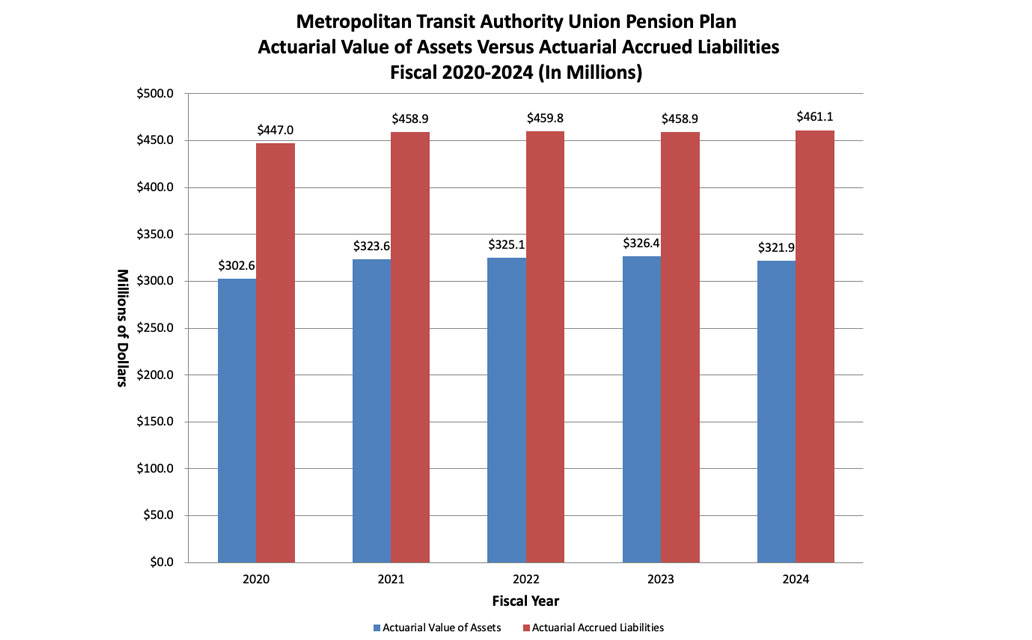
Actuarial Value of Assets Versus Actuarial Accrued Liabilities (In Millions)
| Fiscal Year | Value of Assets | Accrued Liabilities |
|---|---|---|
| 2020 | $302.6 | $447.0 |
| 2021 | $323.6 | $458.9 |
| 2022 | $325.1 | $459.8 |
| 2023 | $326.4 | $458.9 |
| 2024 | $321.9 | $461.1 |
The investment returns are calculated using the geometric method and are presented net of fees.
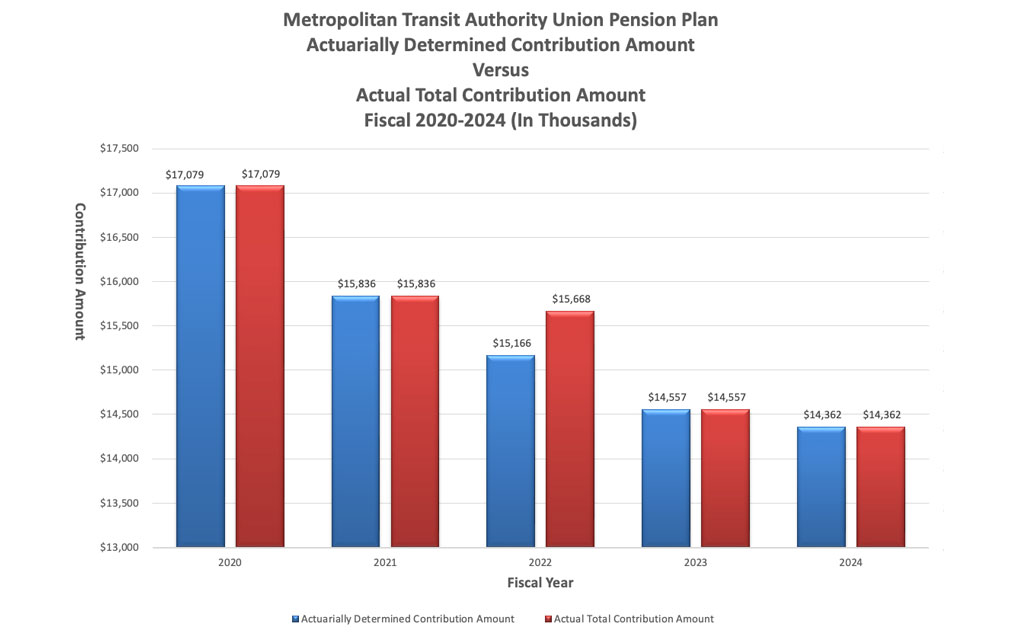
Actuarially Determined Contribution Amount Versus Actual Total Contribution Amount Fiscal Year 2020-2024 (In Thousands)
| Fiscal Year | Determined Contribution | Actual Contribution |
|---|---|---|
| 2020 | $17,079 | $17,079 |
| 2021 | $15,836 | $15,836 |
| 2022 | $15,166 | $15,668 |
| 2023 | $14,557 | $14,557 |
| 2024 | $14,362 | $14,362 |
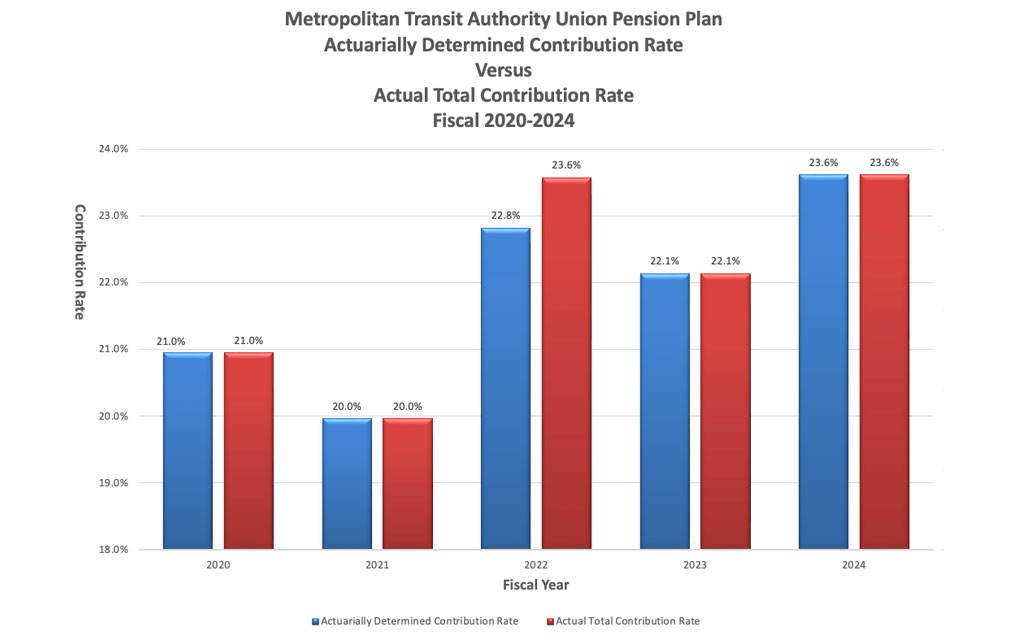
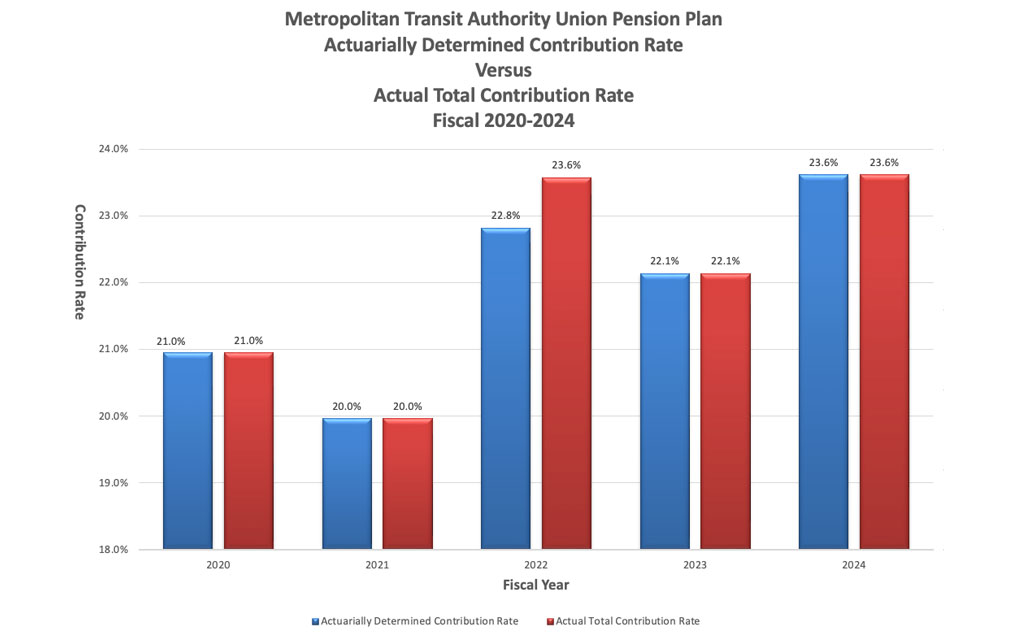
Actuarially Determined Contribution Rate Versus Actual Total Contribution Rate Fiscal Year 2020-2024
| Fiscal Year | Determined Contribution | Actual Contribution |
|---|---|---|
| 2020 | 21.0% | 21.0% |
| 2021 | 20.0% | 20.0% |
| 2022 | 22.8% | 23.6% |
| 2023 | 22.1% | 22.1% |
| 2024 | 23.6% | 23.6% |
Transport Workers Union Pension Plan, Local 260, AFL-CIO For Five Years Ended December 31 for the following years:
| Additions | 2024 | 2023 | 2022 | 2021 | 2020 |
|---|---|---|---|---|---|
| Employer contributions | $14,362,215 | $14,557,542 | $15,668,399 | $15,836,027 | $17,805,961 |
| Pick-up contributions | $85,319 | $103,386 | $142,951 | $164,295 | $184,148 |
| Investment income / (loss) | |||||
| Interest and dividends | $2,160,511 | $1,972,220 | $1,835,654 | $3,874,488 | $3,821,788 |
| Net appreciation / (depreciation) on investments | $20,469,595 | $23,917,246 | -$50,437,482 | $34,202,401 | $30,524,776 |
| Investment income / (loss) | $22,630,106 | $25,889,466 | -$48,601,828 | $38,076,889 | $34,346,564 |
| Less investment expenses | $684,824 | $726,297 | $837,193 | $712,658 | $679,664 |
| Net investment income / (loss) | $21,945,282 | $25,163,169 | -$49,439,021 | $37,364,231 | $33,666,900 |
| Total Additions | $36,392,816 | $39,824,097 | -$33,627,671 | $53,364,553 | $50,929,731 |
| Deductions | 2024 | 2023 | 2022 | 2021 | 2020 |
|---|---|---|---|---|---|
| Paid to Plan members and beneficiaries | $31,365,050 | $30,148,705 | $26,127,147 | $24,083,715 | $23,306,331 |
| Administrative services | $421,981 | $403,087 | $411,191 | $417,525 | $388,021 |
| Total Deductions | $31,787,031 | $30,551,792 | $26,538,338 | $24,501,240 | $23,694,352 |
Non-Union Plan
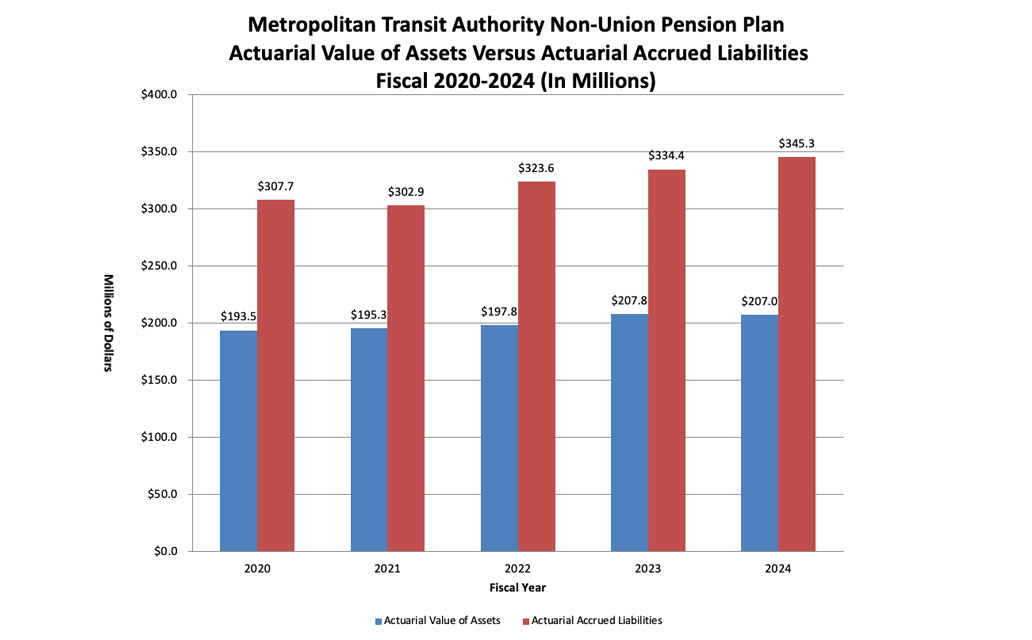
Actuarial Value of Assets Versus Actuarial Accrued Liabilities (In Millions)
| Fiscal Year | Value of Assets | Accrued Liabilities |
|---|---|---|
| 2020 | $193.5 | $307.7 |
| 2021 | $195.3 | $302.9 |
| 2022 | $197.8 | $323.6 |
| 2023 | $207.8 | $334.4 |
| 2024 | $207.0 | $345.3 |
The investment returns are calculated using the geometric method and are presented net of fees.
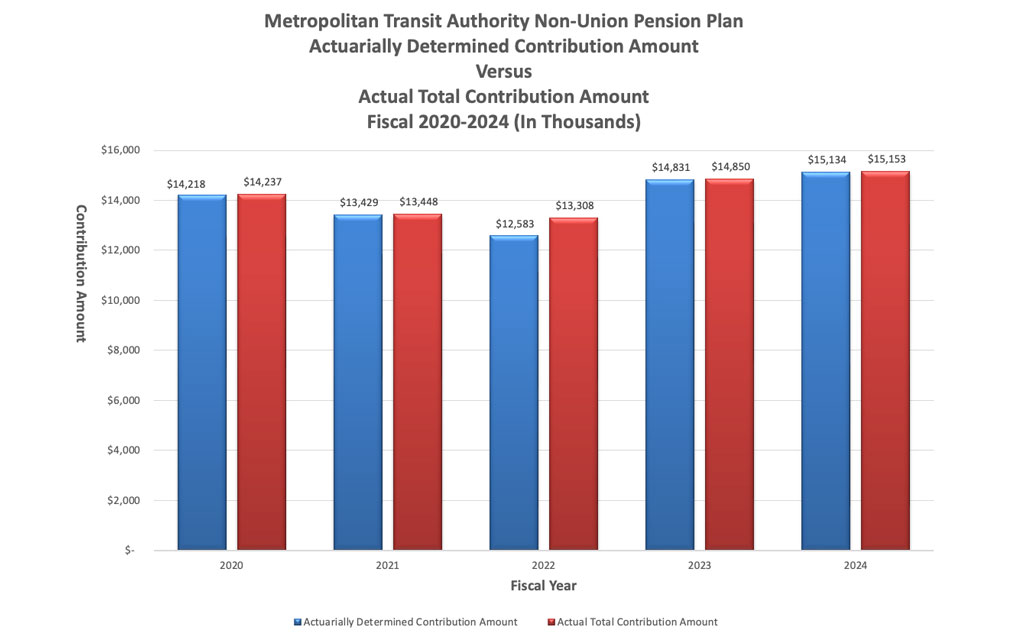
Actuarially Determined Contribution Amount Versus Actual Total Contribution Amount Fiscal Year 2020-2024 (In Thousands)
| Fiscal Year | Determined Contribution | Actual Contribution |
|---|---|---|
| 2020 | $14,218 | $14,237 |
| 2021 | $13,429 | $13,448 |
| 2022 | $12,583 | $13,308 |
| 2023 | $14,831 | $14,850 |
| 2024 | $15,134 | $15,153 |
Actuarially Determined Contribution Rate Versus Actual Total Contribution Rate Fiscal Year 2020-2024
| Fiscal Year | Determined Contribution | Actual Contribution |
|---|---|---|
| 2020 | 37.4% | 37.4% |
| 2021 | 41.7% | 41.8% |
| 2022 | 38.4% | 40.6% |
| 2023 | 44.3% | 44.4% |
| 2024 | 46.0% | 46.1% |
Non-Union Pension Plan For Five Years Ended December 31
| Additions | 2024 | 2023 | 2022 | 2021 | 2020 |
|---|---|---|---|---|---|
| Employer contributions | $15,152,816 | $14,849,952 | $13,308,196 | $13,447,958 | $14,236,592 |
| Investment income | |||||
| Interest and dividends | $1,311,324 | $1,254,943 | $1,045,282 | $1,455,245 | $960,902 |
| Net appreciation / (depreciation) on investments | $14,651,483 | $16,094,346 | -$30,036,961 | $21,752,092 | $20,373,224 |
| Investment income / (loss) | $15,962,807 | $17,349,289 | -$28,991,679 | $23,207,337 | $21,334,126 |
| Less investment expenses | $469,334 | $493,002 | $549,135 | $507,884 | $451,839 |
| Net investment income / (loss) | $15,493,473 | $16,856,287 | -$29,540,814 | $22,699,453 | $20,882,287 |
| Total Additions | $30,646,289 | $31,706,239 | -$16,232,618 | $36,147,411 | $35,118,879 |
| Deductions | 2024 | 2023 | 2022 | 2021 | 2020 |
|---|---|---|---|---|---|
| Paid to Plan members and beneficiaries | $24,700,720 | $15,536,121 | $17,595,120 | $29,179,951 | $16,899,341 |
| Administrative services | $367,436 | $306,556 | $278,324 | $324,750 | $351,276 |
| Total Deductions | $25,068,156 | $15,842,677 | 17,873,444 | $29,504,701 | $17,250,617 |
Documents and Resources
Login credentials are not required to view any of the items shown below. For the reports, after you click or tap on a link, you can then click or tap on the appropriate folder to find your resource.

 Google Chrome
 Safari Mac OS
 Mozilla
 Microsoft Edge